Showing posts with label clinical trials. Show all posts

Friday, July 25, 2025

Catch-22 in Biomedicine: Where Innovation Goes to Die

Welcome to the biomedical field, where the real disease is the system, and the only approved cure is being part of the club.

Let’s start with a fun little circle, a biomedical version of a hamster wheel — Catch-22 with a white coat and a PubMed badge. Here’s how it works:  

  1. To Be Read, You Must Be Indexed.
    No matter how groundbreaking, disruptive, or life-saving your research is, it won’t exist in the eyes of the AI models and policymakers, unless it’s indexed in PubMed. That’s the velvet rope to the scientific VIP lounge.

  2. To Be Indexed, You Must Be Published in a Journal That’s... You Know, PubMed-Worthy.
    And to get into one of those? You need money. Either:

    • Pay the journal a small fortune (ranging from $2,000 to “you’re gonna need a second mortgage”), or

    • Be part of The Club™ - that elite group of insiders who don’t need to pay because they’ve been publishing in the same journals since Watson and Crick shared a sandwich.

  3. Oh, You Did Something Novel? Sorry, That’s Not on the Approved Menu.
    Maybe you developed a cost-saving, patient-driven clinical trial. Fantastic! But if it wasn’t:

    • Funded by Big Pharma, or

    • Backed by the NIH and conducted by a prestige university with ivy-covered walls,
      …then guess what? It doesn’t count. Reviewers will call it “methodologically unsound,” Editors will say "it's not interesting to our readers", which is code for “you didn’t buy the right ticket.”

  4. Citations: The Scientific Echo Chamber
    “You cite me, I cite you, we all cite the same five people we've known since grad school.”
    If your work isn’t already blessed by the existing canon, if it dares to question current paradigms, or (God forbid) it talks about a topic not discussed by the establishment, it’s tossed into the "Thanks but no thanks" pile.

    Citations are the currency of academia. But like real currency, they tend to trickle upward.


Exhibit A: The Case of PATM

Ever heard of People Are Allergic to Me (PATM)? No? Neither has most of PubMed, and certainly not your favorite dermatology AI (that will also tell you it's all in your head).

There was a peer-reviewed paper in JMIR Dermatology showing a microbial connection to PATM. It should’ve led to more interest in this condition. 
But alas, JMIR Derm isn’t indexed in PubMed - a technicality that renders the findings invisible (unless the work was funded by NIH). Not because they’re invalid. Just… you know… they weren’t invited to the club gala.

Now you might think, “But what about establishment research?” Surely that gets through, right?

Monell Center — a well-regarded sensory science institute — published a genetic study on TMAU, another condition ignored for decades. Even they faced an uphill battle. The research showed genetic heterogeneity, meaning the story isn’t as simple as the textbooks would like. Ten years to publish (DNA of 130 subjects that contacted Monnell in 1999 to 2007; the paper was published in 2017). Ten. Because journals prefer tidy answers like “it’s just gene X” over complex truths like “it’s complicated and we don't fully understand it yet.”


Meanwhile, In the Land of AI

Your health chatbot? Your AI diagnostic assistant? It only reads what’s been indexed. It’s like a well-read librarian who refuses to touch any book without a barcode.

Which means all those brilliant papers:

  • From underfunded startups,

  • Crowdfunded patient trials,

  • Off-mainstream yet rigorous researchers...

Are off the radar. So AI, policy, and public knowledge stay blissfully ignorant — not due to a lack of evidence, but a lack of access.


So Why Does This Matter?

Because if you're a poor patient, or a researcher without connections, or someone who just wants to challenge bad assumptions, the system isn't just hard - it's set up to make you invisible.

Innovation doesn't fail here because it’s wrong.
It fails because it wasn’t published in the right place, by the right people, citing the right authorities.


The Streetlight Effect in Science

We’re all looking for the cure under the scientific streetlight - not because it’s there, but because that’s where the funding, indexing, and citations shine.

Meanwhile, in the dark, the real solutions — weird, messy, complex, human solutions - are waiting. But who’s going to look there?

Nobody. Unless someone with the right credentials takes a flashlight.


REFERENCES

Gabashvili IS. Cutaneous bacteria in the gut microbiome as biomarkers of systemic malodor and People Are Allergic to Me (PATM) conditions: insights from a virtually conducted clinical trial. JMIR Dermatology. 2020 Nov 4;3(1):e10508. doi: 10.2196/10508

Guo Y, Hwang LD, Li J, Eades J, Yu CW, Mansfield C, Burdick-Will A, Chang X, Chen Y, Duke FF, Zhang J, Fakharzadeh S, Fennessey P, Keating BJ, Jiang H, Hakonarson H, Reed DR, Preti G. Genetic analysis of impaired trimethylamine metabolism using whole exome sequencing. BMC Med Genet. 2017 Feb 15;18(1):11. doi: 10.1186/s12881-017-0369-8. PMID: 28196478; PMCID: PMC5310055.

Monday, January 2, 2023

Quantified Self: From Sousveillance to Personal Science and Phenotyping

The quantified-self movement which involves using technology to track various aspects of one's daily life and behaviors, could be traced back to the sousveillance-like monitoring described in 1970. One of the first platforms for these activities - Nike+ website publicly launched in 2006 - was helping runners to track and share their workouts. 

The term "quantified self" was coined in 2007 by Wired magazine editors Gary Wolf and Kevin Kelly who co-founded the Quantified Self Institute and "Quantified Self Meetups." The movement experienced a period of rapid growth in popularity in the 2010s. Forbes has even called 2013 "The Year of the Quantified Self". 

As the technology for self-tracking has become more advanced and widespread, it has attracted the attention of commercial hardware developers. Fitbit founded in 2007 as Healthy Metrics Research, released their first tracker in 2009. In the 2010s, a number of major tech companies, including Apple, Google, and Samsung, began to develop and market wearable devices and self-tracking apps.

Quantified Self movement has not become a mainstream trend due to a combination of cost, technical barriers, and privacy concerns. Many people resented self-tracking being pushed by their employers, health and life insurers in order to monitor them. And despite many attempts to develop analysis tools, most people are still lacking the skills to process their data in order to make better decisions in everyday life.

"Personal science" (the use of scientific methods and principles to analyze personal lifelogging) and N-of-1 studies (when individual is studied in isolation, rather than as part of a larger group in a clinical study) are related to the quantified-self movement in that they both involve the use of technology and data to track and understand one's own health and behavior. These approaches, however, are not yet widely used or understood by the general public. 

The use of self-tracking data has the potential to inform the study of various medical conditions through the process of phenotyping, as several papers have demonstrated (eg, for vaccine-triggered anorexia and endometriosis). However, the understanding of how to effectively use this type of data for this purpose is still in the early stages, and it has not yet been widely adopted by traditional medical science. In contrast to what was expected 20 years ago, phenotyping has taken a back seat in human genetics research. It was thought that having a precise or well-measured phenotype was far less relevant than having a huge sample. However, now that the field of genetics has a working strategy for gene discovery, and AI is getting more sophisticated, the importance of phenotype is re-emerging, and this will likely lead to a renewed interest in the quantified self.


REFERENCES

McClusky M. The Nike experiment: how the shoe giant unleashed the power of personal metrics. Wired. 2009 Jun 22;17(07).

Gabashvili IS. Why Red Beans and Rice Are Good ... But Not with Coffee, Forbes 2012, April 30. DOI: 10.6084/m9.figshare.13600517

Osozawa S. Case report: anorexia as a new type of adverse reaction caused by the COVID-19 vaccination: a case report applying detailed personal care records. F1000Res 2022 Jan 4;11:4

Urteaga I, McKillop M, Elhadad N. Learning endometriosis phenotypes from patient-generated data. NPJ digital medicine. 2020 Jun 24;3(1):1-4.

Dick DM. The Promise and Peril of Genetics. Curr Dir Psychol Sci. 2022 Dec;31(6):480-485. doi: 10.1177/09637214221112041. Epub 2022 Sep 16. PMID: 36591341; PMCID: PMC9802013.

==

Special thanks to OpenAI's Assistant for their help with illustrating and writing this article.

Wednesday, October 30, 2019

Correlations and Interpretations

reproduced from Aurametrix blog

We all know that “correlation does not imply causation.” Correlation means X and Y change together, while causation means X makes Y happen. But - as there's a grain of truth in every joke -
seemingly unrelated factors could always be related on some level.


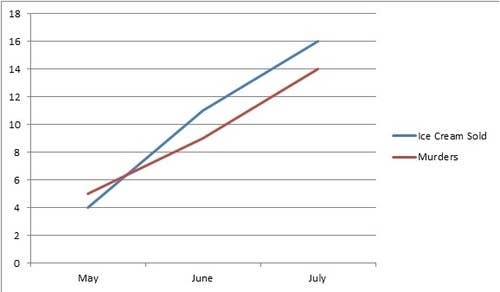
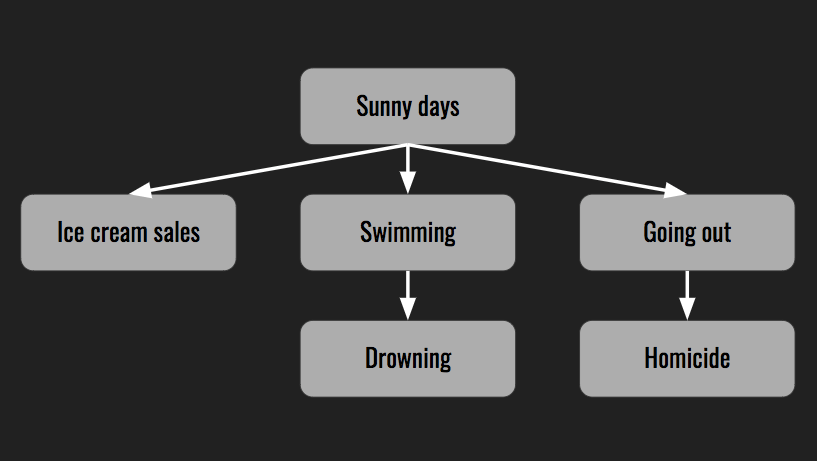
In the case of ice cream sales correlated with drowning death or homicides, the connection is the weather. While soup sales increase during the cold winter months, ice cream sales go up when the temperatures rise. On a nice sunny day more people go for a swim or enjoy the outdoors where there is a wider selection of victims for predators. The most important factor contributing to summer fires is also heat.

The heat wave is an example of a hidden or unseen variable, also known as a confounding variable.

A clinical study might lack control variables - such as the use of placebo. Besides, all possible error sources can't be controlled. But we could reduce the amount of error if we identify all of the possible confounding variables, by a clear understanding of their implications.

How to identify a confounder?  By checking if potential confounding factors are associated with both outcome and exposure variables then comparing associations before and after adjusting for it.

Here is an example. Let's assume we studied 100 MEBO patients that experience symptoms after stress and other triggers and 100 patients in remission tolerant to MEBO triggers. 48 participants experienced stress (30 active state, 18 remission) and 152 participants were exposed to low-to-moderate amount of alcohol (82 out of them were in remission). The unadjusted odds ratio (OR) of experiencing symptoms after stress was 1.95 which means that likelihood for flareups was almost twice higher after stress compared to consumption of alcohol)


Table 1

Number of flareups after triggers
TriggerMEBO symptoms flareup, no. (%)
FlareupNo flareupTotal
Stress30 (63)18 (37)48
Alcohol70 (46)82 (54)152
Total100100200

Unadjusted odds ratio=30×8270×18=1.95

Now we need to find out whether a specific factor, say Bacteria-X, is related to response to stress and/or alcohol.  By looking at Table 2, we see that 50% of the patients with flareups and 20% of the patients in remission have detectable levels of this bacteria in their gut.

Table 2

Distribution of wound infection cases and controls by Bacteria-X status
Have Bacteria XExperiencing flareups
YesNo
No5080
Yes5020
Total100100
It seems that, with a ratio of 2.5, Bacteria-X is related to flaareups in response to stress or alcohol. Now we need to understand if this bacteria is acting up in stress vs alcohol conditions. Table 3 shows the relation between Bacteria-X and type of trigger for 200 patients. Of 70 patients with Bacteria-X, 35 (50%) were exposed to high stress and of 130 patients that don't have bacteria-X, 13 (10%) experienced high stress. Thus, with a ratio of 5.0, we clearly observe that patients with bacteria-X were more likely than patients without bacteria-X to experience stress. At this point, it seems that Bacteria-X is related to both stress and alcohol triggers.

Table 3

Relation between type of MEBO trigger and presence of Bacteria-X
Bacteria-X presentTotalAppendectomy, no. (%)
StressAlcohol
No13013 (10)117 (90)
Yes7035 (50)35 (50)
Second, we need to calculate the adjusted OR and compare it with the unadjusted OR. We first stratify study population to patients with and without bacteria X. Within each stratum, a contingency (2 × 2) table is created and the OR is calculated (Table 4). When we calculate the OR separately for patients with and without bacteria-X, we find that the OR is 1 in each stratum, indicating the lack of association between flareup and type of stress. We could conclude that the unadjusted OR of 1.95 in Table 1 was owing to the unbalanced distribution of those with bacteria-X in their gut microbiome between cases and controls. Thus, in this example, bacteria-X was a confounder, and the association between stress and MEBO symptoms flareup was spurious.

Table 4

Calculation of odds ratio after stratifying by presence of bacteria X
Bacteria-X; stressMEBO flareup, no. (%)TotalAdjusted odds ratio
YesNo
No
 High5 (38)8 (62)135×7245×8=360360=1.0
 Low45 (38)72 (62)117
 Total5080130
Yes
 High25 (71)10 (29)3525×1025×10=250250=1.0
 Low25 (71)10 (29)35
 Total502070

Confounding can be dealt with at the stage of study design (before collecting the data) or at the stage of data analysis (after collecting the data). The commonly used methods to control for confounding factors and improve internal validity are randomization, restriction, matching, stratification, multi-variable regression analysis and propensity score analysis

Notes about odds ratio


Odds ratio is a relative risk, a measure of association between an exposure and an outcome. The odds ratio is calculated using the number of case-patients who did or did not have exposure to a (confounding) factor and the number of controls who did or did not have the exposure. The odds ratio tells us how
much higher the odds of exposure are among case-patients than among controls.

Suppose 200 persons attended a buffet dinner and 55 attendees became ill after it. We asked everyone to describe what they ate  (this is called a case-control study since we compared those with outcome of interest with those who did not have the outcome). 53 of 54 case-patients and 33 of 40 controls mentioned lettuce in their report. The odds of getting sick from lettuce were O1 = 53/33 and the odds of getting sick without eating lettuce was O2 = 1/7, hence the odds ratio for lettuce was about 11.2 (O1/O2)

a = number of persons exposed and with disease  53
b = number of persons exposed but without disease 33
c = number of persons unexposed but with disease 1
d = number of persons unexposed and without disease 7 
a+c = total number of persons with disease (case-patients) 54
b+d = total number of persons without disease (controls) 40

a/b divided by c/d = a*d/b*c  53*7/33 = 11.2


Here are real life scenarios from our microbiome study:
Age - a truly confounding variable?


REFERENCES

Jager KJ, Zoccali C, Macleod A, Dekker FW. Confounding: what it is and how to deal with it. Kidney international. 2008 Feb 1;73(3):256-60.

Rasmussen SH, Ludeke S, Hjelmborg JV. A major limitation of the direction of causation model: Non-shared environmental confounding. Twin Research and Human Genetics. 2019 Feb;22(1):14-26.

Jing S. A Study on Causal Discovery Considering Confounders.

Thursday, November 30, 2017

Fine Tuning Human Networks

Every intelligent entity - whether human or machine - depends not only on the configurations of its neurons, but also connections between itself and others entities, optimized for efficient exchange of information. Hence, better human networks providing training and feedback from others will lead to both smarter humans and better AI. 


blockquote { margin:1em 20px; background: #dfdfdf; padding: 8px 8px 8px 8px; font-style: italic; }